A blip on a radar screen
The claim at the centre of signal detection theory is that performance on any task requiring someone to judge whether a faint or ambiguous signal is present cannot be reduced to a single percentage-correct score, because two genuinely separate things are being measured at once: how well the person can actually distinguish the signal from background noise, and how willing they are to say yes at all when uncertain. This distinction mattered because two people, or two diagnostic tests, could achieve the identical overall accuracy for entirely different reasons, one by being genuinely better at detection and one simply by guessing yes more often, and a single combined score could not tell them apart. The theory’s answer was to treat every judgement as a decision made under uncertainty, against a backdrop of real noise, rather than as a simple readout of whether a signal was detected.
Two groups, one year, one idea
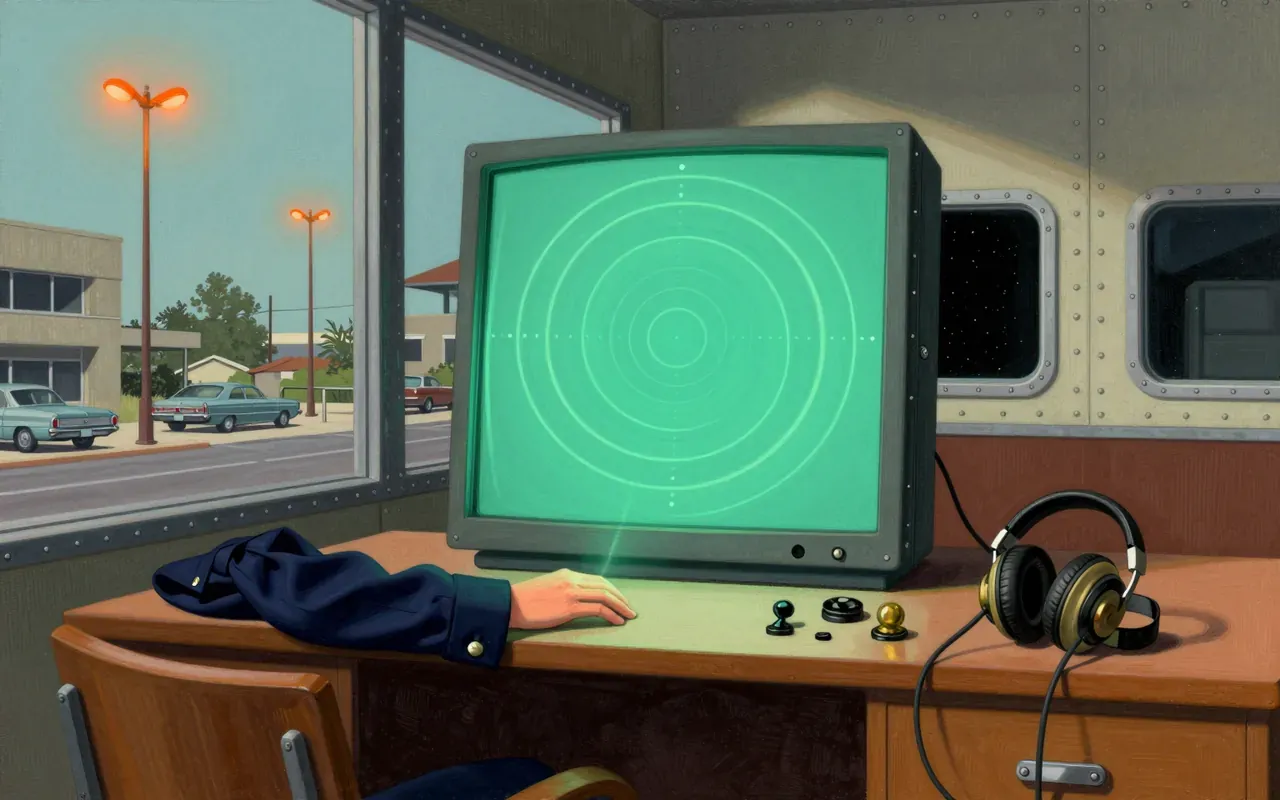
The problem originated in the 1940s with radar operators, who had to decide from a noisy screen whether a given blip represented a genuine target or random interference, a task with obvious high stakes and genuine ambiguity. Peterson, Birdsall and Fox gave the underlying mathematics its full formulation in 1954, and in the same year, working independently, the psychologists Wilson Tanner, David Green and John Swets built a parallel version of the theory suited to psychological experiments rather than radar engineering. Green and Swets brought the framework fully into psychology with their 1966 book, Signal Detection Theory and Psychophysics, which set out how every trial in a detection experiment could be sorted into one of four outcomes: a hit, correctly reporting a signal that was present; a miss, failing to report one that was; a false alarm, reporting a signal that was not there; and a correct rejection, correctly reporting that nothing was there.
Four outcomes, not one score
What has held up, and spread far beyond its original radar context, is the core separation between sensitivity and bias. Sensitivity is typically summarised using a measure called d-prime, or through the area under a receiver operating characteristic curve, which plots the hit rate against the false alarm rate as the willingness to respond yes is varied, giving a picture of detection ability that does not depend on any single arbitrary threshold for responding. This framework has been adopted well outside psychology, in medical diagnostic testing, industrial quality control, telecommunications, and the study of eyewitness identification and memory accuracy, precisely because the same underlying problem, distinguishing a real signal from noise while accounting for a decision-maker’s willingness to respond, recurs across all of these fields in a mathematically identical form.
Splitting skill from willingness
What the theory does not do, by its own design, is tell anyone where to actually set the threshold for responding yes. That decision depends on the relative costs of the two kinds of error, a miss versus a false alarm, and modern applications typically layer additional mathematics, such as maximum a posteriori testing or a Bayes criterion, on top of the basic framework to set an optimal threshold given those costs and the prior probability that a signal is actually present. The theory also sits inside a broader, older and still partly unresolved argument in psychophysics about how sensation itself scales with the intensity of a physical stimulus, with one classic account, Fechner’s law, proposing a logarithmic relationship and a rival account from Stanley Smith Stevens proposing a power-law relationship instead, a disagreement signal detection theory does not settle on its own.
A curve, not a point
The practical reach of this framework is considerable precisely because so many real decisions share its basic structure. A medical screening test’s performance is reported using concepts drawn directly from signal detection theory, distinguishing how well it detects real disease from how often it raises a false alarm in healthy people, a distinction with direct consequences for how a test’s results should be interpreted and used. Eyewitness identification research uses the same framework to separate a witness’s genuine ability to recognise a face from their general willingness to make an identification at all, a distinction that bears directly on how much weight courts should place on eyewitness testimony. Quality control processes in manufacturing, and detection problems in telecommunications and compressed sensing, all draw on the identical mathematical structure to decide how confidently a system can flag something as present against a background of noise.
Structure without a verdict
Selectively, yes: the value here is conceptual rather than narrative, so it rewards someone who wants a genuinely useful analytical tool rather than a story with a single dramatic discovery. The framework is worth understanding because it quietly underlies how a great many real-world detection decisions, medical, legal, industrial, get evaluated and reported, and because separating sensitivity from bias is one of those ideas that, once learned, is hard to stop noticing in situations where a single accuracy number is being used to hide two very different underlying explanations. It is less rewarding as a story of discovery, since the theory arose from parallel work by separate groups solving a wartime engineering problem, and the drama here is in the idea’s usefulness rather than in how it was found.