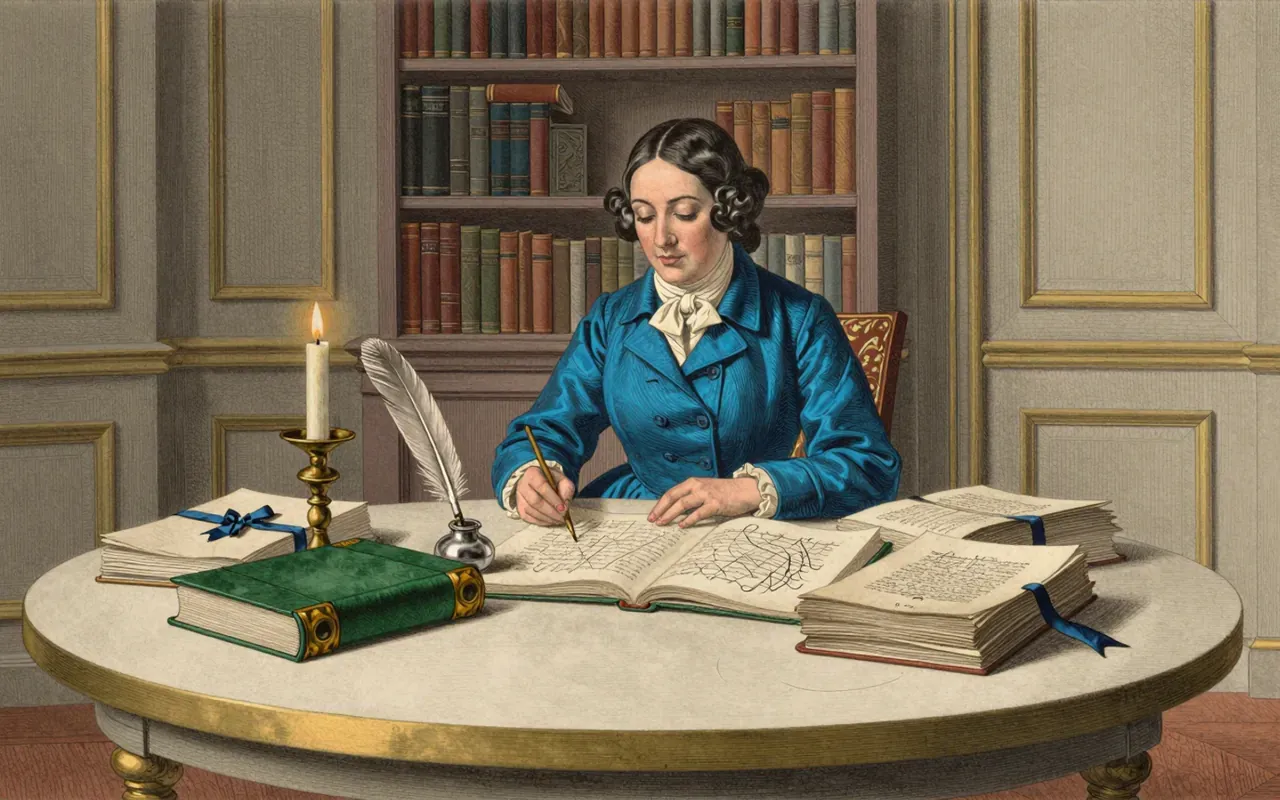
She didn’t just nurse the wounded—she weaponised graphs and soap.
Florence Nightingale’s contribution was operational, statistical, and political—not clinical. She applied hygiene as intervention, visualised data for decision-makers, and proved sanitation reduced mortality where medicine failed. Her conclusions were grounded in field data—not ideology.
Handwashing was deployed as an intervention—not just advised, but implemented.
2:39
Graphs as policy tools
She invented no new math—but redesigned how statistics speak to power.
4:02
India: 10 years, 51 fewer deaths per 1,000
A 51-per-1,000 drop in soldier mortality proves sanitary reform had measurable impact.
5:14
Non-medical > medical (in 1855)
Her numbers convinced her that clean water and ventilation mattered more than doctors’ orders in 1855.
6:41
Who really cut the death rate?
The 42% to 2% claim is attributed to Paget—not verified as Nightingale’s direct achievement.
8:17
Evidence over authority
She concluded this not from theory—but from comparing preventable vs. treatable causes in her field data.
Worth your time?
Yes. Study the whole thing.
4.5/ 5
What works
handwashing implementation
graphical communication of statistics
sanitary reform mortality outcomes
non-medical priority inference from field data
What does not
42% to 2% reduction was Nightingale’s personal achievement
Study it if
policymakers
epidemiologists
data visualisers
Skip it if
clinicians seeking treatment protocols
historians without primary-source context
The written brief1 min read
What the work claims
That hygiene improvements—notably handwashing—and systematic sanitary reform reduced military mortality. That graphical representation of statistics could translate evidence into policy action. That non-medical interventions were more effective than medical ones at the time.
How it was done
Nightingale implemented handwashing in her hospital. She used polar area diagrams—circular histograms—to visualise mortality data for policymakers.
What holds up
Handwashing was implemented. Graphical statistics were used to communicate findings. Mortality in India fell from 69 to 18 per 1,000 after ten years of sanitary reform. Her Crimean War data led her to conclude non-medical interventions were more effective than medical ones given contemporary knowledge.
What does not
The document does not establish that Nightingale personally achieved the 42% to 2% reduction—it attributes that claim to Stephen Paget, who said it occurred either through her own actions or by prompting the Sanitary Commission.
Why it matters beyond the lab
It established sanitation as a measurable, actionable lever in public health—and showed how data visualisation can bridge technical analysis and political will.
Is it worth your time
Yes. Her work shows how simple hygiene interventions and clear data visualisation can drive systemic change in public health.
Joseph Fourier claimed in 1807, studying how heat spreads through a solid, that almost any function could be rebuilt from sine and cosine waves alone — a claim reviewers thought too bold to be rigorous, and one still central to JPEG images and digital audio.