Mapping from data collected by others
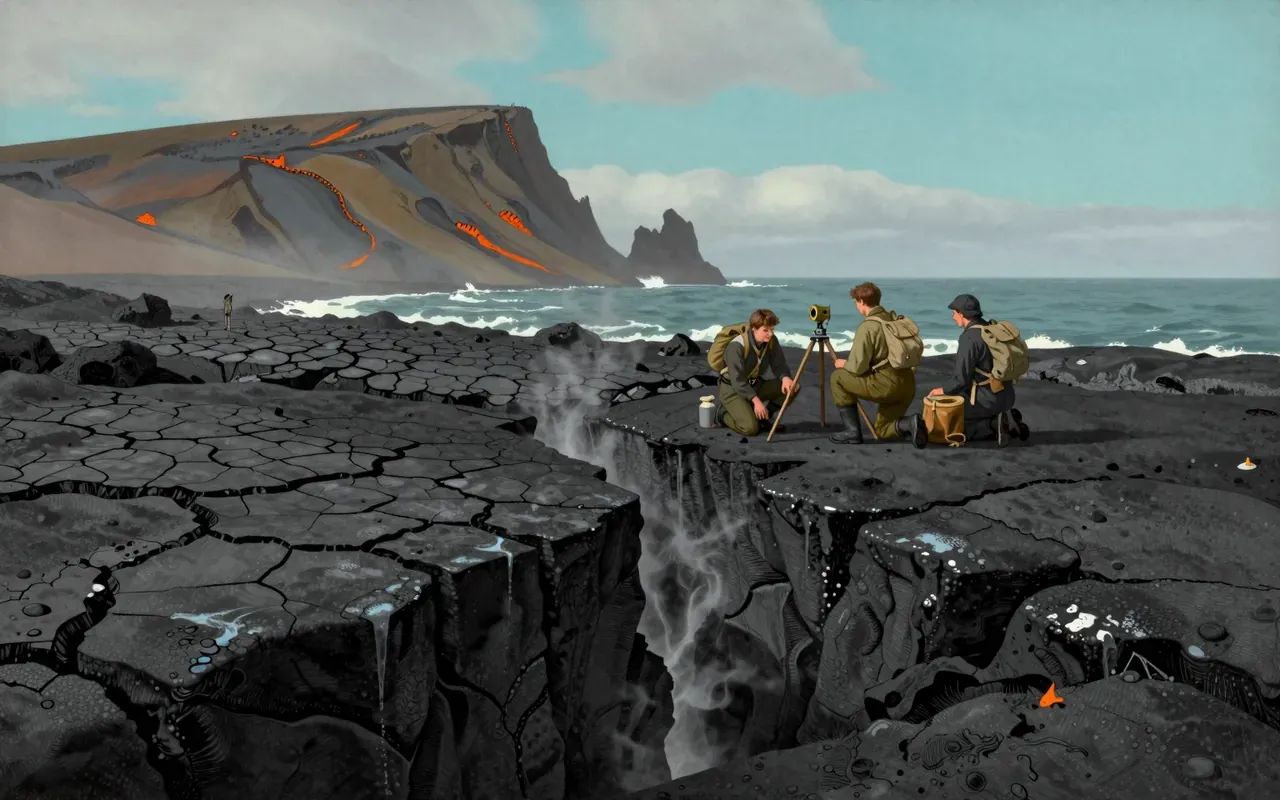
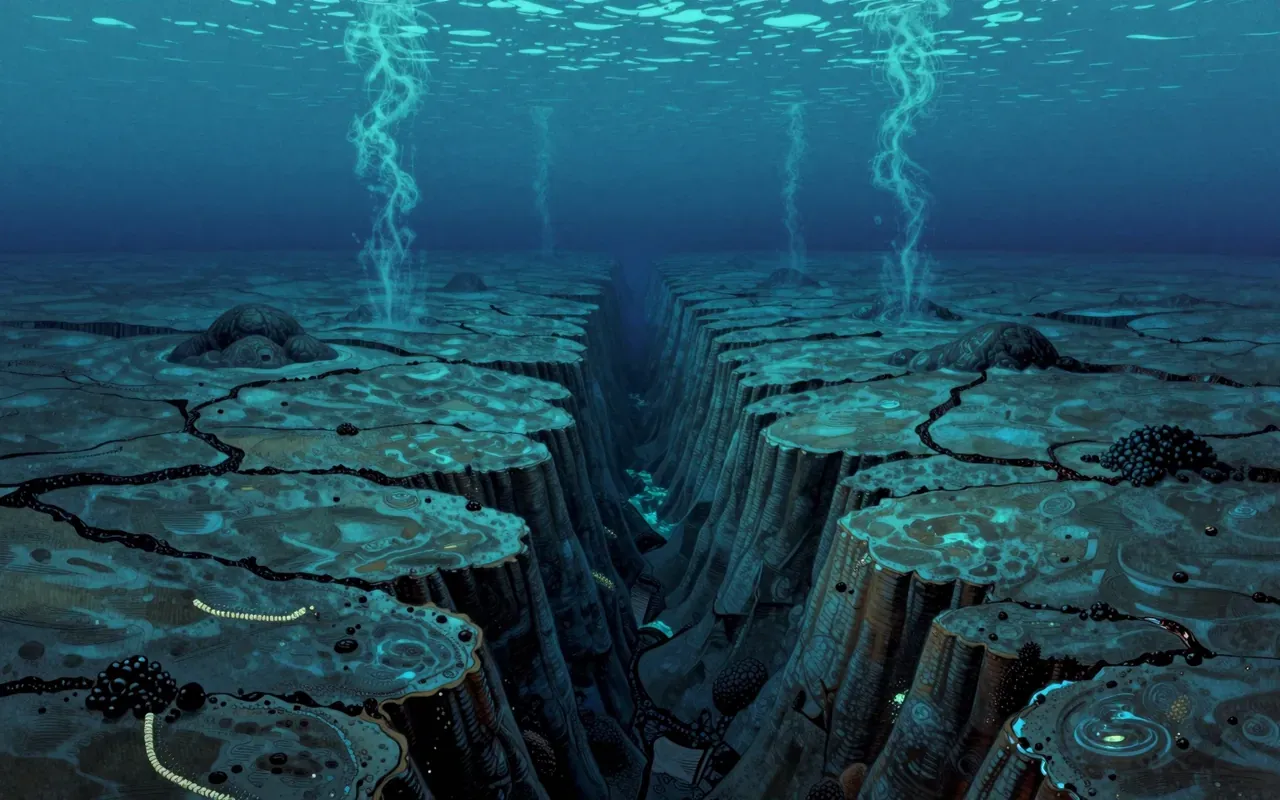
Marie Tharp joined Columbia University’s Lamont Geological Observatory in 1948, at a time when women were barred from research vessels, meaning her work depended on data gathered at sea by others, principally her colleague Bruce Heezen, who spent years collecting echo-sounder soundings of the ocean floor aboard the research vessel Vema. Tharp’s role was to translate those raw depth readings into maps and profiles, a task that put her in an unusually good position to notice patterns across a large volume of data that no single shipboard observation could reveal on its own. In 1952, working through sounding profiles across the mid-Atlantic ridge, she identified something specific: a continuous, v-shaped feature running down the axis of the ridge that she interpreted as a rift valley, a long crack marking a place where the seafloor was actively splitting apart.
A rift valley in the sounding profiles
That interpretation was not immediately accepted, even by her own research partner. Heezen reportedly dismissed the idea as girl talk when Tharp first proposed it, a reaction shaped partly by the fact that a genuine rift valley of this kind would support continental drift, the theory that continents move over geological time, which the wider geological establishment had already largely rejected by the mid-twentieth century as implausible given the physical mechanisms then known. Tharp’s specific technical claim, a continuous valley running the length of the ridge, was therefore not merely a mapping detail but a direct challenge to an already-settled professional consensus, which is part of why it met resistance rather than being simply checked against the data and accepted or rejected on its own terms.
Dismissed for supporting the wrong theory
The vindication came from an independent line of evidence. A map of earthquake epicentres, compiled separately by seismologist Howard Foster, turned out to align precisely with the path of the rift valley Tharp had traced from the sounding data, since actively splitting crust generates exactly the kind of seismic activity a rift valley would be expected to produce. That correspondence between two independently derived datasets, bathymetric soundings on one hand and earthquake locations on the other, gave Tharp’s interpretation a strength that her mapping work alone had not been enough to establish on its own, and it persuaded Heezen and the wider field that the rift valley was real rather than a misreading of ambiguous sounding data.
Earthquakes confirm the valley’s position
Getting the resulting map published presented its own separate obstacle, distinct from the scientific dispute: Cold War-era restrictions limited the publication of detailed ocean floor topography, since such data had military significance for submarine navigation. To work around this, Tharp and Heezen presented their findings in an artistic, physiographic style rather than as a strictly technical bathymetric chart, publishing their first such map of the ocean floor in 1957. That stylistic choice was a practical workaround for a security restriction rather than a scientific decision, but it also happened to make the map more accessible and visually striking to a broader audience than a conventional technical chart would have been.
A map disguised to get published
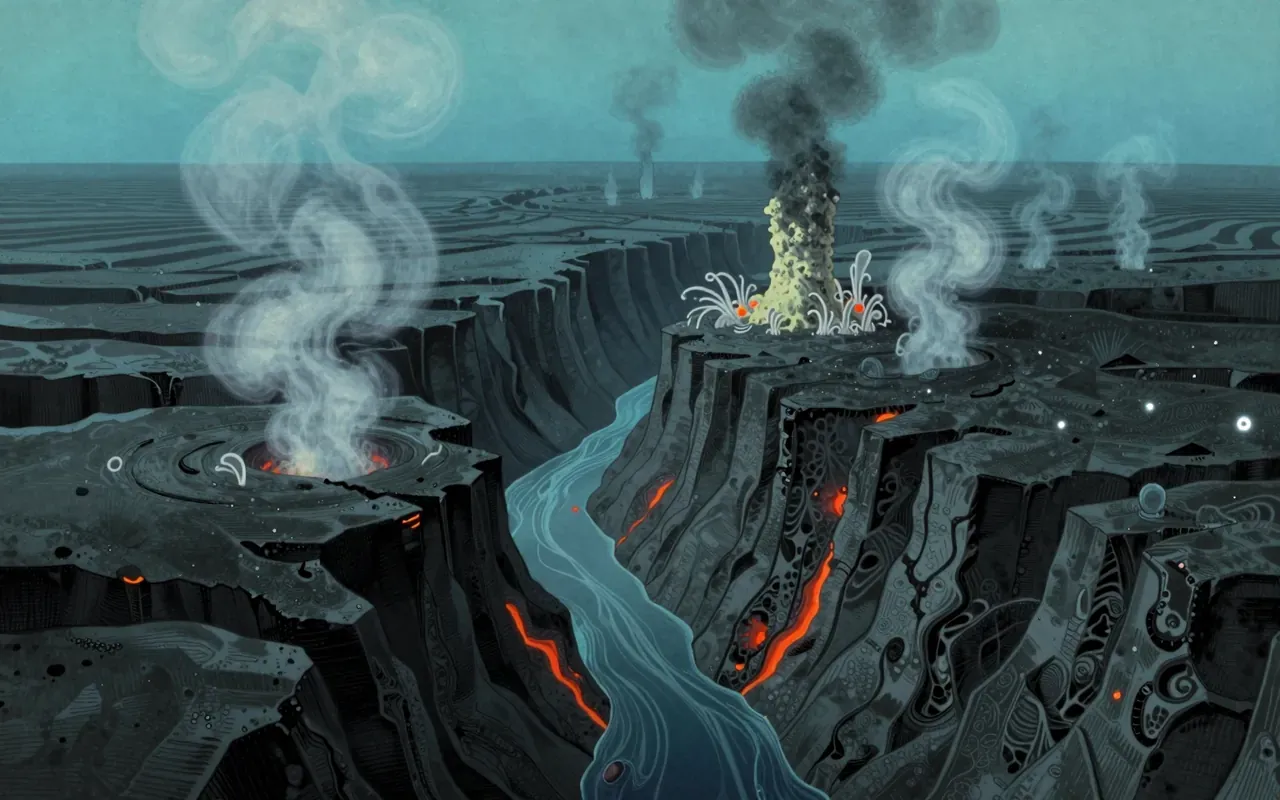
The wider significance of Tharp’s rift valley finding extended well beyond the mid-Atlantic ridge itself, since further mapping revealed that mid-ocean ridges of this kind exist throughout the world’s oceans, forming a single continuous system roughly 65,000 kilometres long, extending to nearly 80,000 kilometres including its branches, making it easily the longest mountain range on Earth by a wide margin. These ridges mark divergent plate boundaries, where mantle material rises, melts through decompression, and erupts to form new oceanic crust at rates ranging from about 10 to 200 millimetres per year, with faster spreading producing gentler ridge slopes and slower spreading producing steeper ones with more pronounced rift valleys. This global evidence directly supported Alfred Wegener’s long-dismissed continental drift theory and fed into the development of plate tectonics as the accepted framework for geology during the 1960s.
One ridge, 65,000 kilometres long
This is genuinely worth understanding in full, both as a piece of earth science and as an account of how a specific, correct observation nearly went unheeded because it happened to support an unfashionable theory and came from someone whose institutional position gave her contribution less initial credibility than it deserved. The confirmation by earthquake data is a satisfying, concrete detail that turns the story from an anecdote about being dismissed into an actual demonstration of how independent lines of evidence resolve genuine scientific disputes. Tharp’s maps are now recognised as foundational to plate tectonics, and readers interested in how major geological paradigm shifts actually happen, rather than how they are summarised after the fact, will find this a rewarding and well-documented case.